Student Projects Spring 2019
Poverty In New York City: Identifying Households for Utility Assistance
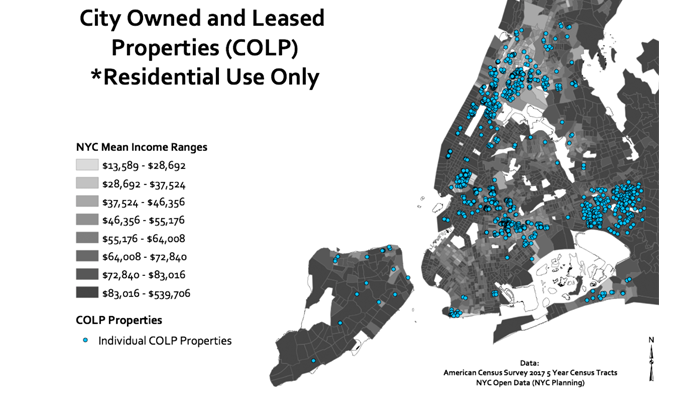
Poverty in New York City is layered and complex. Even more complex are the various financial assistance programs that residents may or may not qualify for based on any number of factors, such as income and citizenship status. The Low Income Home Energy Assistance Program (LIHEAP), commonly known as HEAP, is a federal grant designed to assist low income households with their heating and cooling costs. In New York City, LIHEAP is administered by the Human Resources Administration (HRA). A file match system with HRA has identified a potential 200,000 customers that are LIHEAP eligible, but that do not apply to the program. Privacy regulations do not allow HRA to unmask customers; given these limitations, this project utilizes various indicators and spatial relationships to determine potential eligibility to the program.
GIS PresentationProject Methods
Street Flooding in NYC: Spatial Assessment of Most Impacted Areas
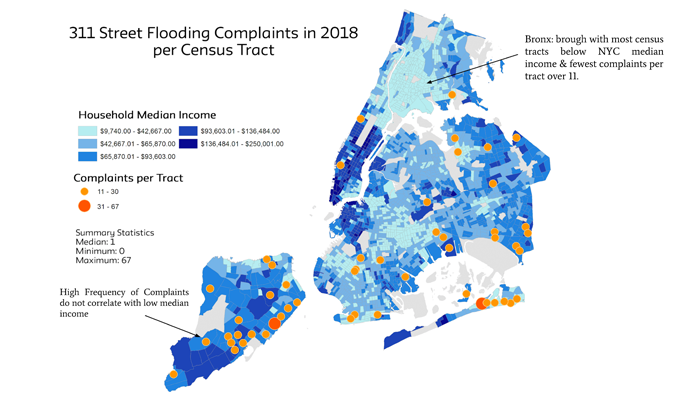
As a coastal city, New York must pay special attention to increased flooding and associated risk factors. As the city has more frequent experiences with climate-related events, it must consider mitigation opportunties. This analysis aims to determine if street flooding specifically, is a concern for coastal areas only or if there are is a relationship between street flooding and household median income. Using street flooding complaints submitted to New York City 311 from 2015 to 2018, this analysis determined if there has been an increase in flooding complaints and if those complaints constitute discrete geographies. The analysis found that although there has been an increase in frequency of complaints over time, that tends to impact the same areas regardless of demographic variables such as median income.
GIS PresentationProject Methods
A Spatial Analysis of Structurally Deficient Bridges in the United States
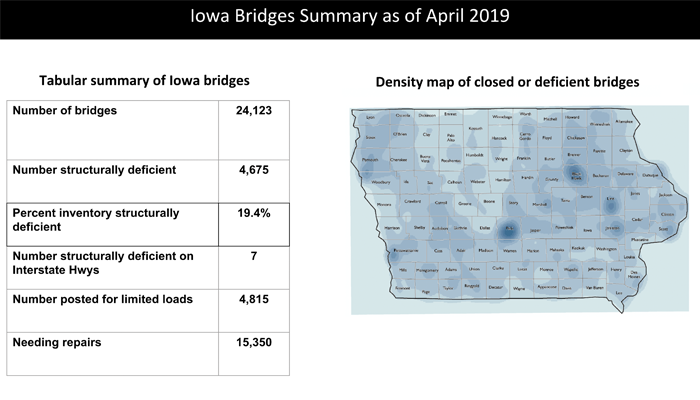
Using three states as examples, a spatial analysis of structurally deficient bridges was mapped, to show the percentage of total bridges categorized as deficient. The map process was to plot the points of each bridge by latitude and longitude and then code those in most critical condition as, 0's - bridge closure; 1-2's - urgent repair or replacement necessary; and, 3-4's - in serious condition, but can be used with limited loads and other restrictions. For the three states used, a density map showing concentrations of deficient bridges was displayed for each. It simplified the visual presentation, as individual data points overcrowded the map. For the financial data, each county in the three states had summations of every federal highway funding award for the prior five fiscal years. By overlaying the density maps on top of the county maps, the relationships between high levels of funding and bridge deficiency concentrations could be analyzed. For the most part, the two data measurements matched. There were some exceptions in two states, where funds were awarded and bridge deficiences were lower than some other areas that didn't receive as much. The opposite case was also true in a few other instances. Generally, funding and bridges in need of urgent work matched up. There remains a national problem of states securing enough funding to do bridge repair or to make matching amounts in order to qualify for federal funds for new projects. Revealed as part of the literature and periodical searches, the aggressive tax policies of Iowa for gas and oil products stood out as a workable solution. Much of their deferred maintenance now has revenue targeted for bridge repair and replacement. The policy recommendation at the conclusion of the report is that other states should follow Iowa's lead.
GIS PresentationProject Methods
Participatory Urban Planning: Mukuru, Nairobi: The Education Sector (Mukuru Project #1)
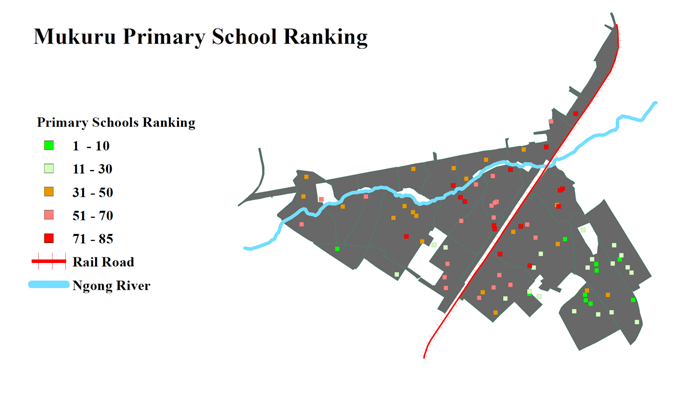
This specific project utilizes GIS (Geographic Information Systems) to map and analyze Mukuru, Nairobi. At all levels of government, GIS can be used to help improve transparency, identify at risk communities and help to manage critical community resources. The project locates all the schools throughout Mukuru as well as hazards to school sites across sectors. The project provides an overview of the main challenges facing the education sector in Mukuru to facilitate the work towards an integrated development plan for Mukuru. Based on community outreach components of the project, various priority criteria were determined. Based on these criteria, the project identified the following challenges as the four most pertinent to Mukuru:
- Infrastructure and location
- The quality of education and the curriculum
- Overall facility design
Project Methods
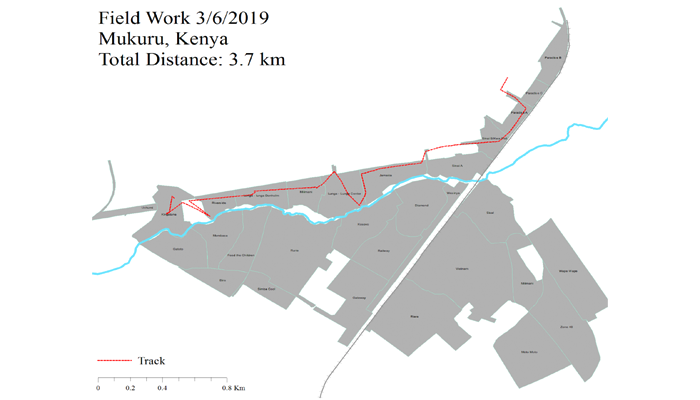
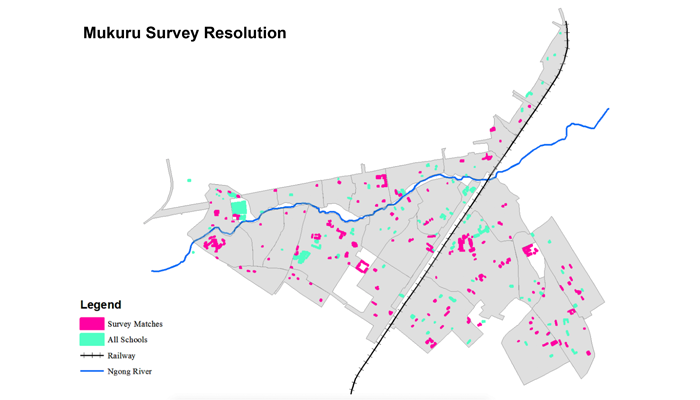
Participatory Planning in Mukuru (Mukuru Project #2)
The Mukuru slums, some of the largest slums in Nairobi, cover almost 650 acres and are home to at least 300,000 people. Despite having a brief respite from the demolition of homes, schools, and businesses due to its current designation as a Special Planning Area (SPA) the future still remains uncertain for many community members. The future is also quite precarious as can be seen from the demolishment of schools in the neighboring slum of Kibera last year. This project utilzes spatial data - partly resulting from field collection methods of the project team - and spatial analyses to address this uncertainty. This was done by using survey data from 86 primary schools in Mukuru to identify schools the schools that are in the best and worst condition based on the criteria derived from community consultations. It is the hope of this project that the stakeholders in Mukuru will be able to use both the spatial analysis and vulnerability weighting program to more accurately rank the schools in Mukuru prior to the terminiation of the SPA.
GIS PresentationProject Methods
Participatory Planning in Mukuru (Mukuru Project #3)
The Mukuru slums, some of the largest slums in Nairobi, cover almost 650 acres and are home to at least 300,000 people. Despite having a brief respite from the demolition of homes, schools, and businesses due to its current designation as a Special Planning Area (SPA) the future still remains uncertain for many community members. The future is also quite precarious as can be seen from the demolishment of schools in the neighboring slum of Kibera last year. This project utilzes spatial data - partly resulting from field collection methods of the project team - and spatial analyses to address this uncertainty. This was done by using survey data from 86 primary schools in Mukuru to identify schools the schools that are in the best and worst condition based on the criteria derived from community consultations. It is the hope of this project that the stakeholders in Mukuru will be able to use both the spatial analysis and vulnerability weighting program to more accurately rank the schools in Mukuru prior to the terminiation of the SPA.
GIS PresentationProject Methods