Student Projects Spring 2019
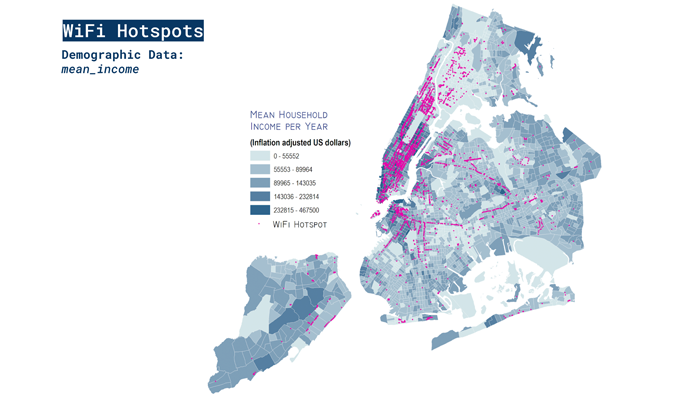
NYC Connected: Mapping Internet Access
The increasing digitization of society has led to an array of new challenges and issues including inequalities in data access as well as privacy. Scholars have highlighted biases and injustices created by use of big data that increasingly target low-income communities. In a city known for its massive income inequality, how may this affect internet access as well as the internet types of access households rely on? Using data from the 2017 American Community Survey 5-year estimates as well as NYC Open Data, this study spatially analyse and identify correlations between income levels and availability of free public WiFi hotspots as well as links between income levels and less reliable access to the internet. By spatially mapping three indicators of internet access, this study has identified three areas which have high concentrations of households that may have poor access to the internet or “unreliable” and potentially less safe access, these are areas in Bushwick, the Bronx and Lower Manhattan.
GIS PresentationProject Methods
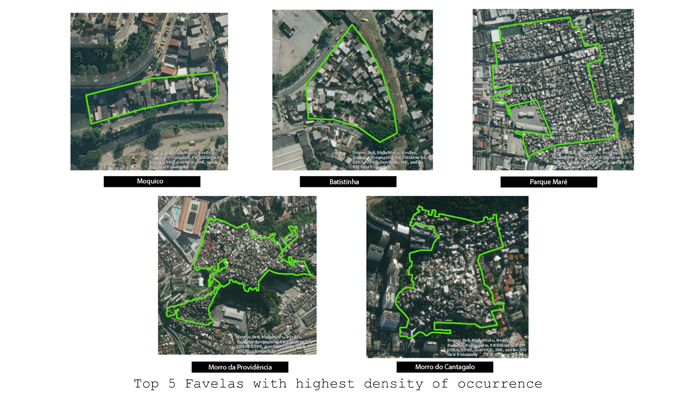
The Spatialization of Gun Violence in Rio de Janeiro
Launched in 2016 in conjunction with Amnesty International, Fogo Cruzado (Cross Fire) is an open-source real time, data based app for gun violence in Rio de Janeiro. Official government data from Rio de Janeiro breaks down by crime type, not weapon type. Gun violence statistics and information is not officially collected by the city (Obsorn, 2016). Fogo Cruzado seeks to fills a vital data gap by creating a crowd-sourced record of gun-related violence within the city. Gun related homicide has increased 387% since the 1980s (Muggah). In 2018, then-President Michel Temer put the military in charge of Rio de Janeiro in the face of escalating violence, especially during Carnival (Phillips, 2018). However, this was criticized by favela residents, who argue that military and police presence increases their insecurity, as many people suffer violence at the hands of police (Phillips, 2018). To that end, Fogo Cruzado is also used as the citizen’s eyes - keeping watch on gun violence and holding perpetrators accountable. This project utilizes the Fogo Cruzado dataset to map large scale geographies marked by gun-related violence. Aerial imagery is then used to show typography of favelas most affected by gun violence, by both rate and density. These maps show us that the North Zone is disproportionately affected by gun violence, with high volumes occuring in areas with UPP officers.
GIS PresentationProject Methods
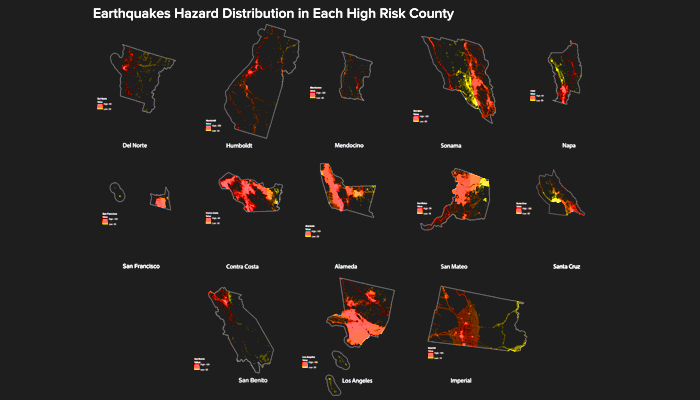
California’s Persistent Earthquake Hazard: A spatial analysis of risk to the built environment
California has a long history of earthquakes, which are mainly attributed to San Andreas Fault across California. The vast movement of the earth’s crust results in most earthquakes, and California land is formed by Pacific plate and North American plate, San Andreas Fault, just between the two plates. There are hundreds of known faults in California, generating earthquakes of various magnitudes. Nearly 70% of population in California live within 30 miles surrounding the faults with strong earthquake potential. A further major reason for the earthquake casualties or damage is the collapse of buildings. This spatial analyis addresses built environment risk using proximity to earthquake potential throughout California. Analysis is further mapped utilizing California counties as the geographic unit of analysis.
GIS PresentationProject Methods
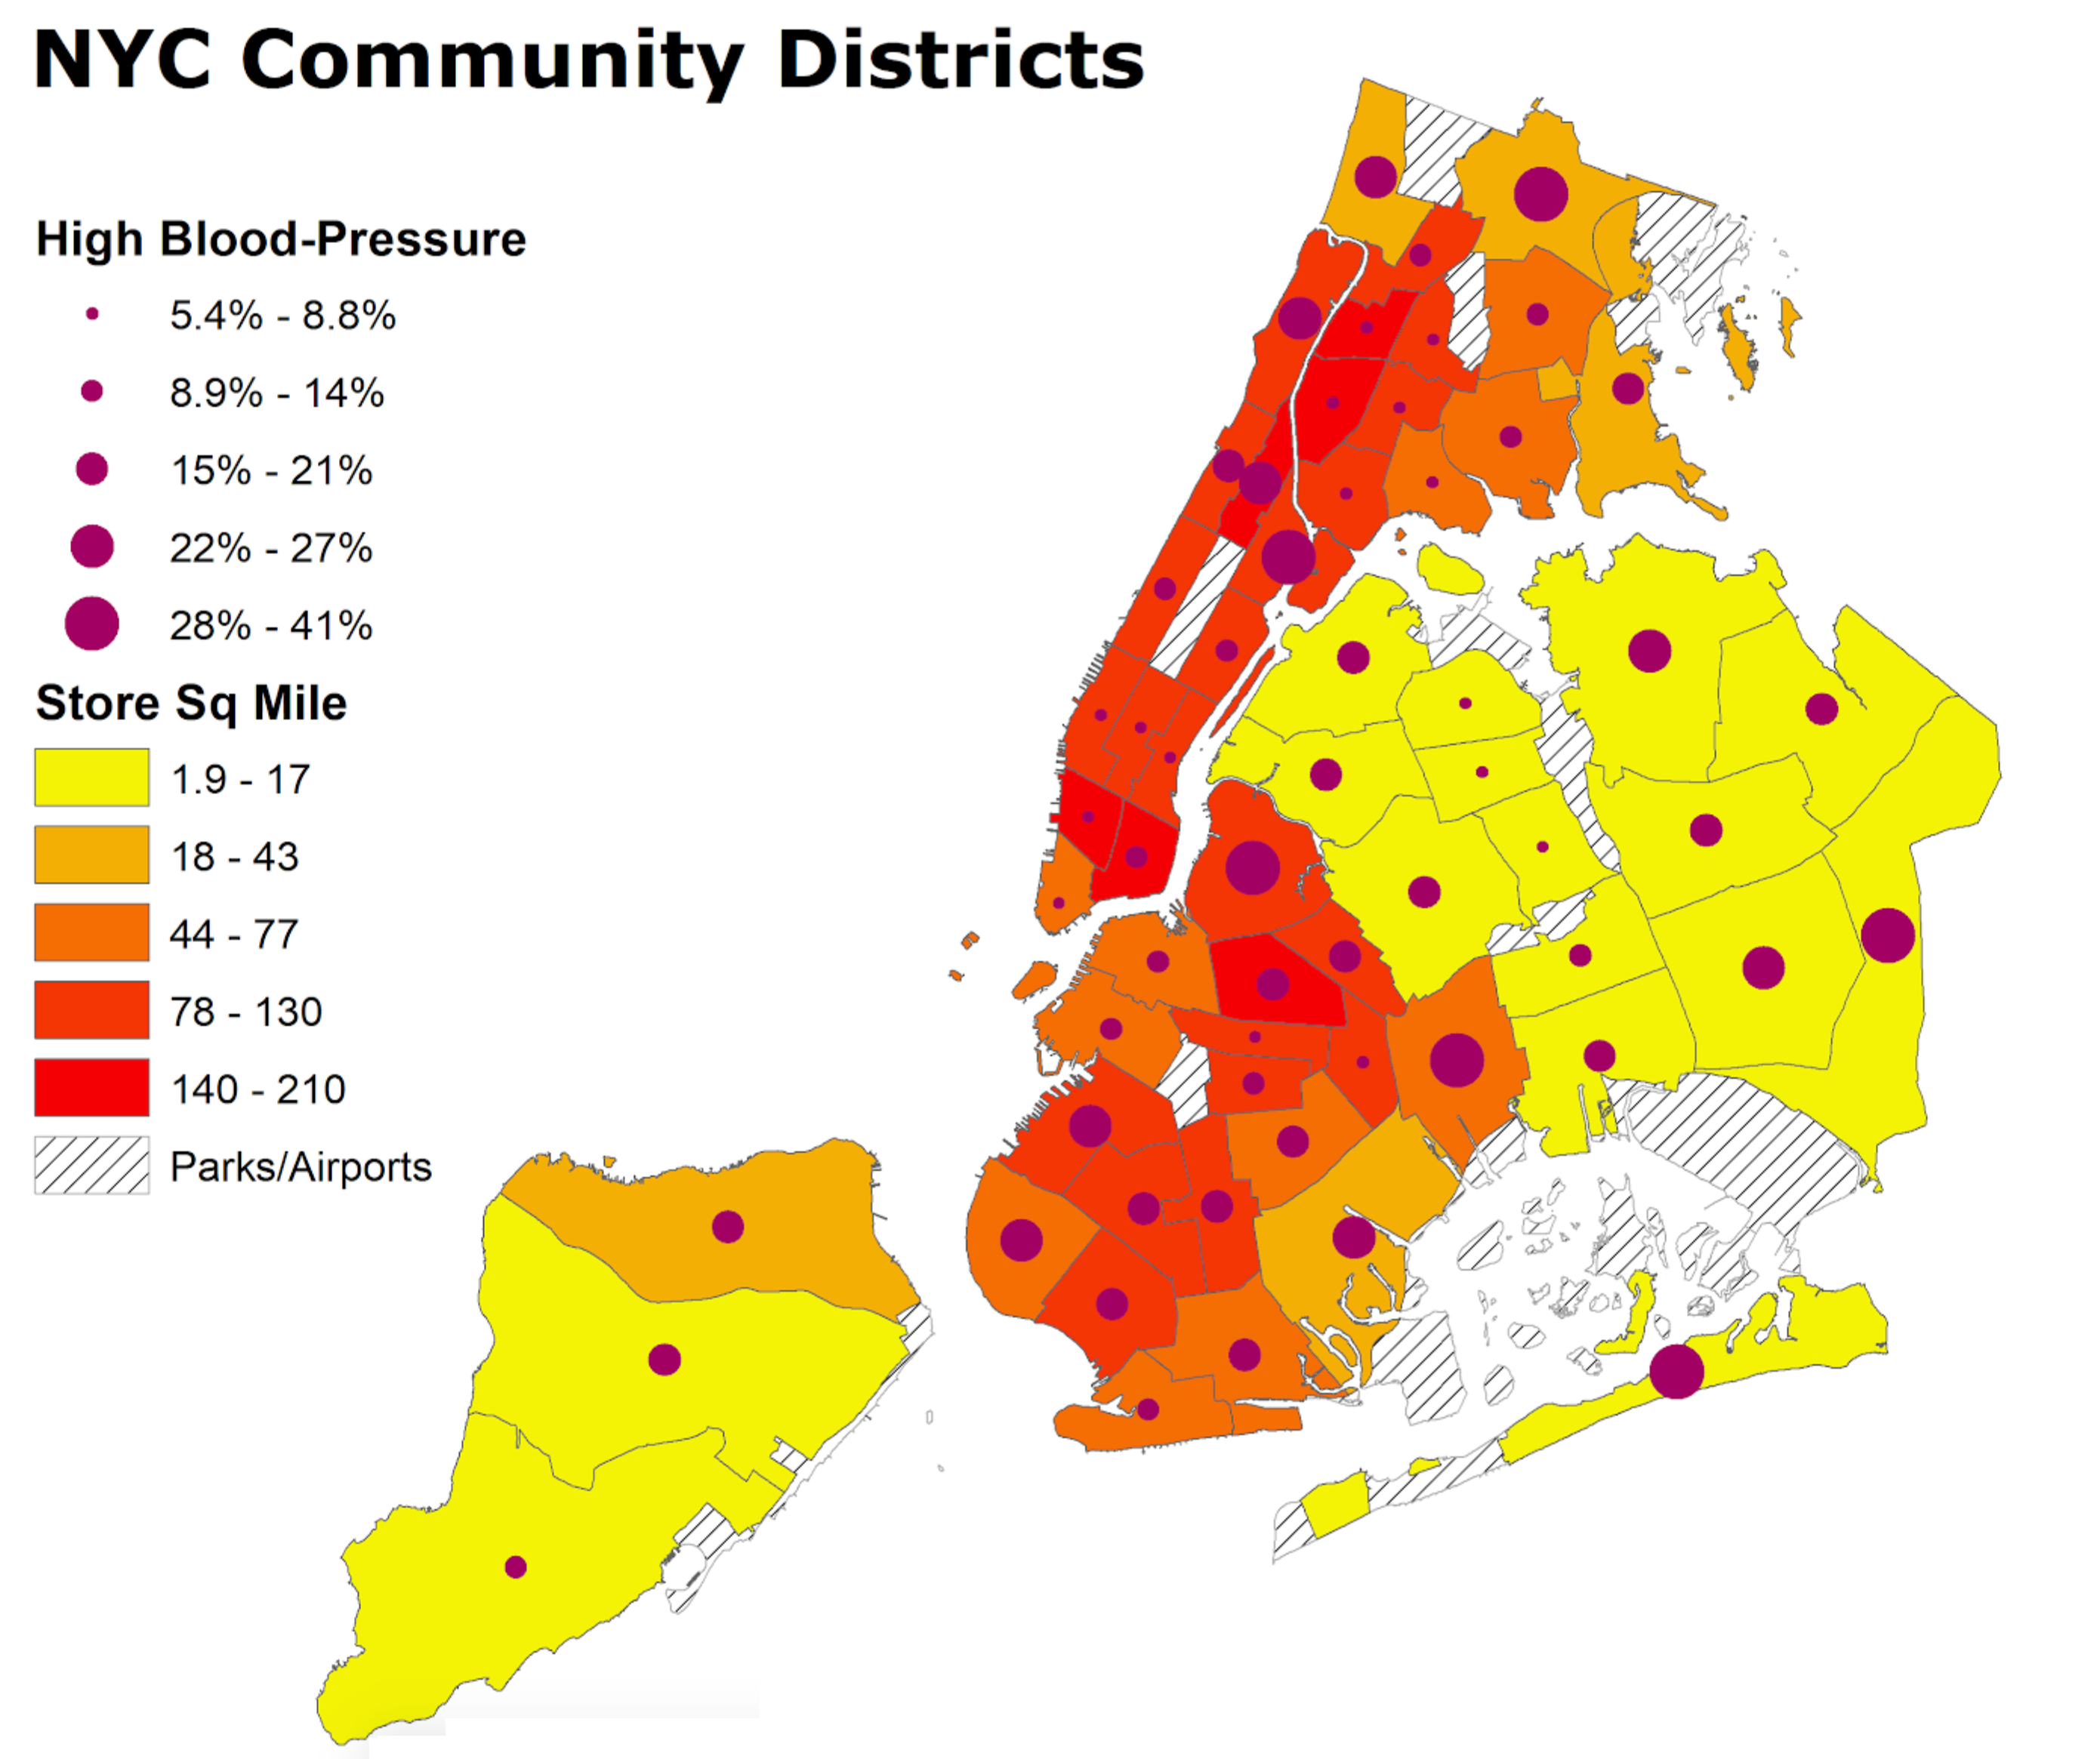
Spatial Analysis of Food Access in New York City
New York City (NYC) features extremely diverse, often disparate demographics. With high demographic variance, it is intriguing to examine the different aspects contributing to the well being (or lack thereof) of its constituents. This study utilizes several data points: retail food stores, educational attainment, poverty rate and diseases of modernity as a proxy for assessment of equitable food access for each of NYCs 59 Community Districts (CD). Subsequently, a scoring system was developed highlighting the top three vulnerable CDs, overlayed with NYC Food Retail Expansion to Support Health (FRESH) geography. Results identified commonalities and unique aspects of the top three vulnerable districts.
GIS PresentationProject Methods
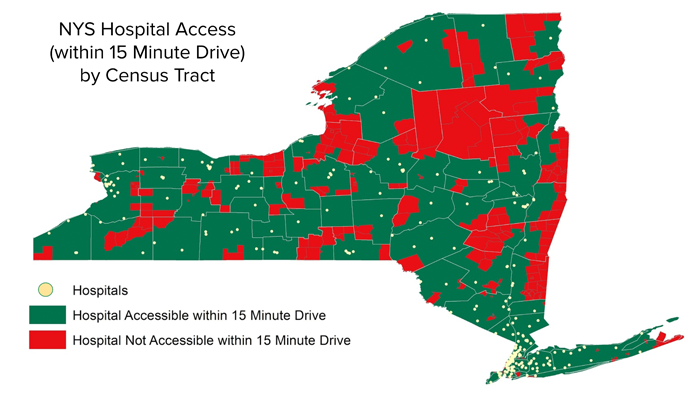
Where Does It Hurt?: Mapping Risk in Maternal and Infant Health Outcomes in New York State
Maternal and infant health outcomes in the United States are the worst in the developed world, and New YorkState is one of the worst culprits. Because health outcomes are a result of a confluence of interacting social,physical, and environmental factors, collectively called the social determinants of health, it can be difficult to notonly measure who is most at risk for poor outcomes, but to understand how to mitigate those risks. Here, anattempt was made to capture several different dimensions of risks using: county-wide historical maternal andchild health outcomes rates, census-level concentrations of certain social characteristics regarding race andinsurance coverage, and infrastructural accessibility via a network analysis. Each category was split along threelines, generally centered around the median. Almost every group was given a ranking of 1, 2, or 3, correspondingto low risk, moderate risk, and high risk. Hospital access was ranked similarly, but those with accessibility weregiven a ‘0’ for no risk, and those without accessibility were given a ‘3’. A final vulnerability score was calculated atcensus-tract level. The lowest possible score, indicating the least vulnerable areas, was an 8. The highest possiblescore was a 27, indicating extremely vulnerable areas. High risk was found to be concentrated largely in cities, butalso effect significant portions of several more rural counties.
GIS PresentationProject Methods
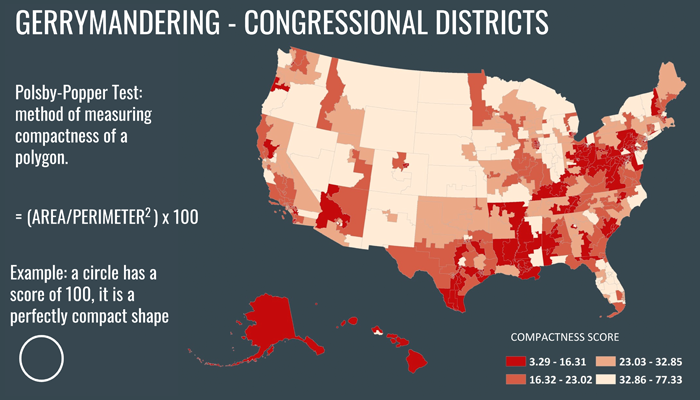
Voter Suppression Vulnerability Mapping
The purpose of this project is to identify areas in the United States that are most vulnerable voting suppression. To assess the locations and severity of these vulnerabilities, the analysis uses three variables that are associated with this phenomena; the presence of restrictive legislative actions, areas with a high percentage of people of color, and congressional districts that show signs of partisan gerrymandering. Using GIS software, the analysis utilizes data from the United States Commission on Civil Rights 2018 Report, the American Community Survey 2013-2017 Five-Year Estimates, and the United States Census Bureau's database of TIGER/Line Shapefiles to identify counties that are the most vulnerable. The results of the analysis point to nineteen counties that have a high vulnerability to voter suppression; nine of which are in Alabama, four in Georgia, two in North Carolina, and one in Arizona, Florida, Georgia, and Pennsylvania.
GIS PresentationProject Methods