Student Projects Spring 2018
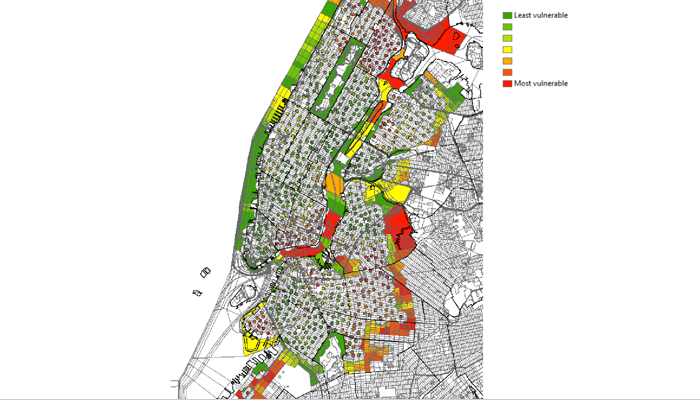
The (Bike)keys to a better NYC: spatial analysis of the Citi-Bike network through a social vulnerability lense
Bike share systems are proliferating nationwide, potentially transforming mobility choices in urban centers. However, the rollout, operation and expansion of bike share networks necessitate a range of spatial choices that impact the equity of service delivery. While the New York City (NYC) Citi Bike network enjoys the highest rate of ridership in the country, critics have argued that the network falls short against certain equity metrics, and disproportionately benefits affluent inner-city residents and visitors. This spatial analysis set out to better understand how well the bike dock network is serving NYC residents, as revealed by social vulnerability indicators at the census tract level, bike dock usage levels, and dock density. The analysis finds that the population of the Citi Bike service area is significantly less vulnerable than the city as a whole, and that dock density and dock use fall from the center of the network towards the periphery. This analysis is also used to inform a hypothetical future dock placement informed by a spatial analysis for social vulnerability.
GIS PresentationProject Methods
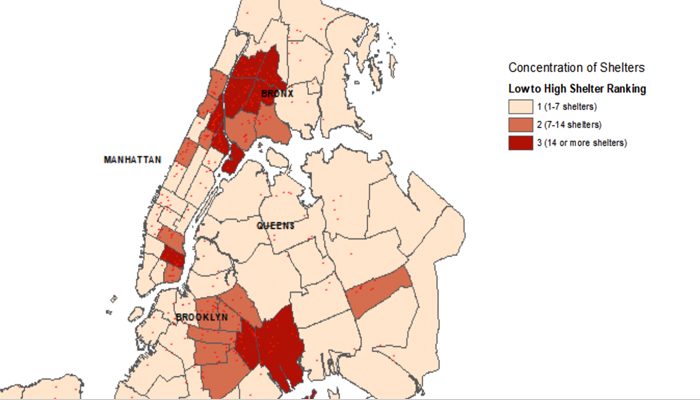
Thematic Mapping of NYC Homeless Shelters and Crime
New York City is experiencing rising rates of homelessness, and many New Yorkers lack access to safe and adequate affordable housing. Many studies have examined the impacts of homelessness and how it relates to the development of pervasive mental illnesses and co-occurring substance use issues. The nexus of such issues heightens exposure to arrests and incarceration. While shelters should be places where vulnerable populations can turn to for assistance and support, the placement of these facilities may actually be putting these individuals at an even greater risk of crime, exacerbating their vulnerabilities. Though some communities possess greater political power to resist the development of homeless shelters and supportive housing units in their neighborhoods, other underserved areas lack this capacity; and, as a result, experience the clustering of shelter units. Through a series of thematic maps, the relationship between homeless shelter placement and high crime areas in New York City is explored.
GIS PresentationProject Methods
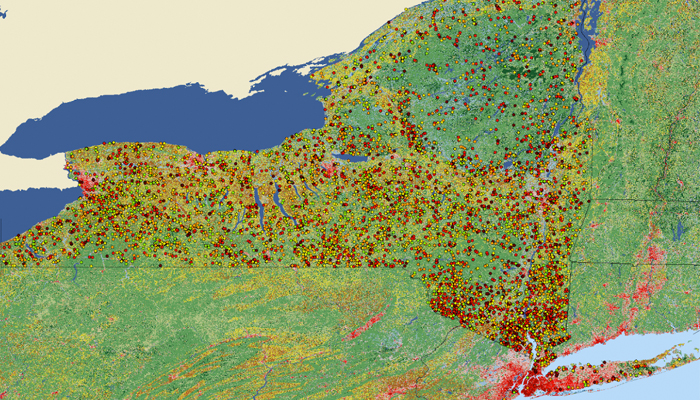
Ranking New York State Dams for Flood Vulnerability
This project assesses the vulnerability of dams in New York State based on the permeability of the surrounding ground cover per dam site. Dams featuring high permeability are ranked low, while those with low permeability are ranked high. Based on project results, vulnerable dams are typically near urban environments; however several factors can affect permeability of the area, such as elevation, grass coverage and adjacent water bodies.
GIS PresentationProject Methods
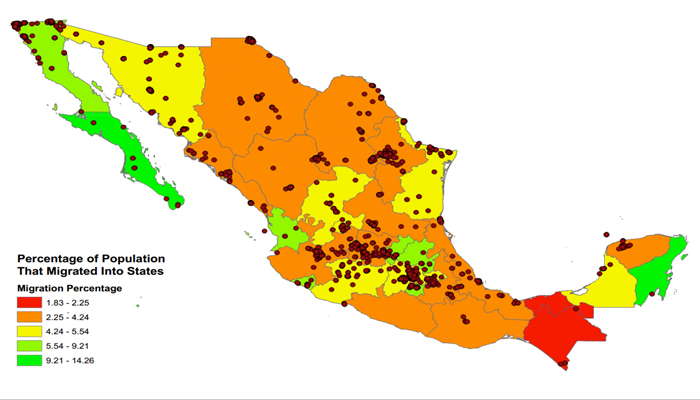
NAFTA and Migration in Mexico
The North American Free Trade Agreement (NAFTA) was passed December 8, 1993, and officially went into effect January 1, 1994. This agreement was the first major international trade agreement that would address the agricultural sector, the environment, and intellectual property rights. The United States, Canada, and Mexico are the three parties privy to this agreement. This project utilizes points locations from the IMMEX database of maquiladoras and census migration data to ascertain if the built environment closely tied to NAFTA policies corresponds with in-migration trends within Mexico states.
GIS PresentationProject Methods
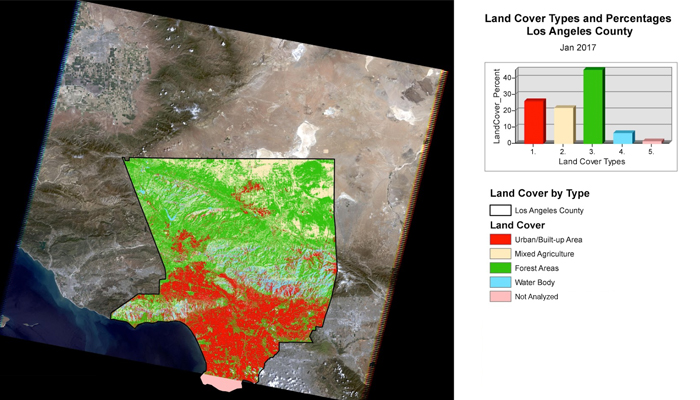
Remote Sensing Monitoring and Assessing Land uses, Los Angeles, CA
Urbanists can utilize remote sensed imagery to quantify the urban sprawl in both spatial and temporal scales for better planning and sustainable management of urban centers. This Project uses remote sensing and GIS Applications to identify and Assess Urban Sprawl in Los Angeles. From year 1950-2000, the city of Los Angeles has grown about 88%. In the past decade on its own, the city has been regarded as an exception to the rules that govern America urban growth. Initially a small region in Southern California, with no apparent potential urban growth, Los Angeles continues to expand horizontally at rapid rates.
GIS PresentationProject Methods
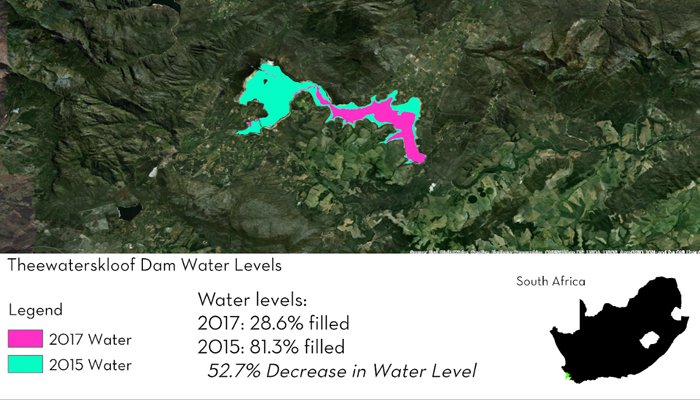
Remote Sensing analysis of water levels, South African Dams 2013-2018
South Africa has been experiencing a drought since 2015. With this has come unprecendented water shortages. Most notably, the city of Cape Town, SA which was recently approaching "Day Zero." While Day Zero has now been postponed to 2019, it highlights a critical aspect of the crisis - water storage. Utilzing NDWI analysis, the project classifies and visualizes the temporal and spatial change of several important water source dams critical to Cape Town.
GIS PresentationProject Methods