Student Projects Spring 2018
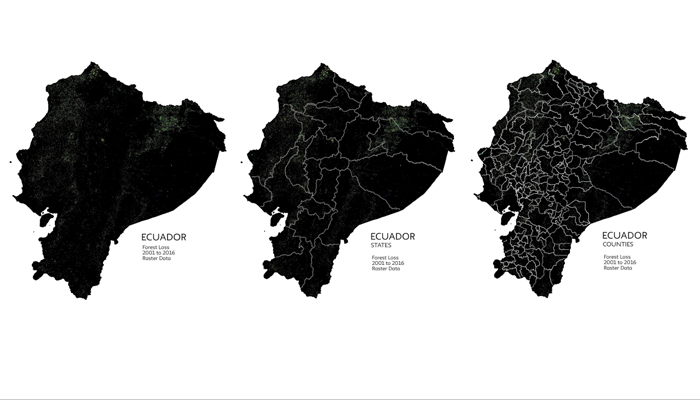
Deforestation in Ecuador
Since 1970, when oil extraction began in earnest, Ecuador has experienced increasing rates of deforestation in the Amazon. Indeed, the country has one of the world’s highest rates of deforestation - estimated at over 3% of its total forest cover per year. This spatial analysis illustrates locations particularly vulnerable to loss within Ecuador.
GIS PresentationProject Methods
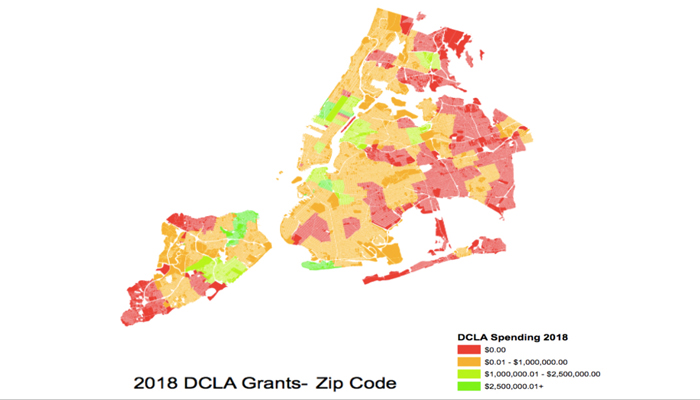
Mapping New York City Arts Spending
New York City possesses the largest public art funding agency in the United States, providing thousands of grants every year, providing construction for applicable spaces, as well as running 33 city-owned art institutions. This project seeks to ascertain the spatial distribution of arts funding throughout the 5 boroughs on NYC, utilizing an extensive data cleaning process tied to the city's parcel base. Results are aggregated to zip code geometry, allowing for a quick discernment of priority areas as well as spatial inequities in the city's funding system.
GIS PresentationProject Methods
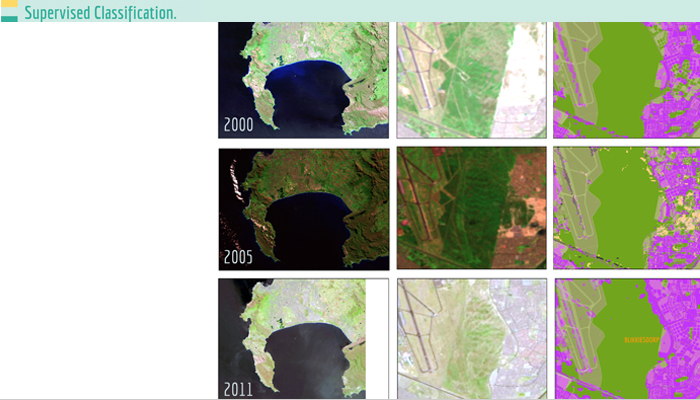
Infrastructure inequalities within the City of Cape Town, South Africa
This project investigates the inequalities of Cape Town, South Africa through mapping access to specific public infrastructure, namely street lighting, bus rapid transit stops and routes, as well as taxi routes which (typically informal). Remote sensing imagery supervised classification of years 2001 and 2011 were constructed to visualize urban growth in the study areas.
GIS PresentationProject Methods

A Case for Green Infrastructure in the Rockaways, Queens
Green infrastructure is an approach to water management that protects, restores, or mimics the natural water cycle, and promotes the natural movement of water by collecting and managing stormwater run-off. In the Rockways, Green Infrastructure is nearly obsolete because of the presence of its separated sewer system. Through Geographic Information Systems (GIS) tools, a suitability analysis was conducted to ascertain locations for green infrastructure interventions. Results will be used within the Rockaways community as a basis for a community-driven proposal to the Department of Environmental Protection for the Rockaways to be integrated into the green infrastructure network.
GIS PresentationProject Methods

Spatial Analysis of Minority Women Owned Business Enterprises and Airport Concessions
The Minority Women Owned Business Enterprise (MWBE) program is scattered across several directories - Port Authority of New York and New Jersey, New York State Empire Development, and New York City Small Business Services directory. As such, there is no single-source repository or comprehensive analysis of this important program. This project considers the spatial dimension of Minority Women Owned Businesses. Findings include spatial disparities by community district and zip code (Queens, NY); Women Owned Business Enterprises make up less than 50% of the combined directories; and 92% of the certified businesses were notated on two or less directories. A visibility index was also constructed for Queens, NY participating businesses, revealing how many businesses were certified across all directories.
GIS PresentationProject Methods
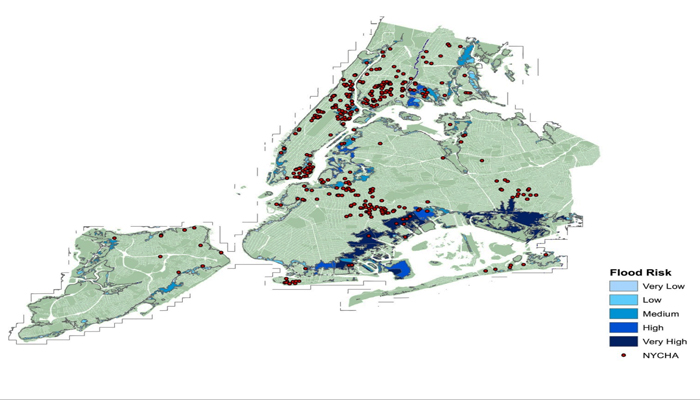
Assessing Flood Risks to NYCHA Housing Developments, New York City
Utilizing predicted flooding inundation geometries for future years 2020 and 2050, this project sought to ascertain risk for New York City Housing Authority (NYCHA) developments. Spatial analysis results show a significant portion of the NYCHA building stock will be increasingly at risk of flooding and inundation associated with climate change in the future. For a infrastructure that is publically funded, this is an unwelcome but unavoidable fact, one that policy makers must grapple with in the near future.
GIS PresentationProject Methods