Student Projects Spring 2025
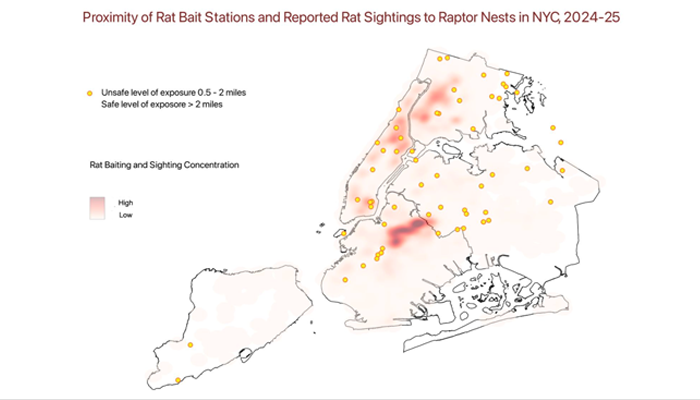
Renee Zalles | Raptor Safety Assessment in NYC
The use of Anticoagulant Rodenticides (ARs) in NYC has increasingly become a risk for raptors who have made the city their home. Raptors’ consumption of poisoned rats leads to a build-up of ARs in their systems that kills them. As an indicator species, changes in raptors within a single ecosystem act as a crystal ball for future inhabitants of that system, including humans. As such, it’s essential that we change our AR use before it’s too late. One way to protect raptors in the short-term is to identify which nests fall in a heavily-baited region of the city. With this information, the city can determine which nests are at highest risk and pause baiting activities in that area until the raptor has vacated the nest, or at least until the babies have fledged and are less vulnerable to lethal poisoning. This is just a start however. A comprehensive plan is being developed by the NYDOH to begin a more holistic approach to rat mitigation in the city that will ensure the safety of all urban species.
GIS PresentationProject Methods
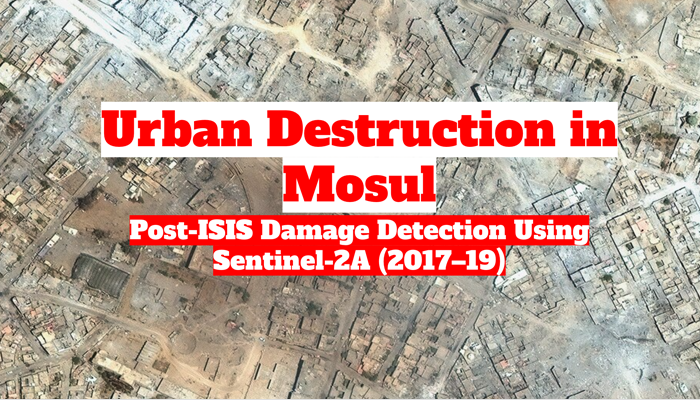
Sanidhya Sharma | Urban Destruction in Mosul: Post-ISIS Damage Detection Using Sentinel-2A (2017-19)
Between 2014 and 2019, the city of Mosul, Iraq, “fell” from the Iraqi govt and witnessed widespread destruction due to intense combat and occupation by ISIS. This devastation was compounded by the use of so-called "3D landmines"—improvised explosive devices planted not only on roads and floors but hidden within walls and ceilings of multi-story structures, turning entire buildings into vertical kill zones. This project uses Sentinel-2A optical satellite imagery to assess the spatial extent of damage in post-conflict Mosul. By calculating and analyzing NDVI (Normalized Difference Vegetation Index) and NDBI (Normalized Difference Built-up Index) differentials across two time periods, I mapped visible changes in vegetation cover and urban infrastructure.
GIS PresentationProject Methods
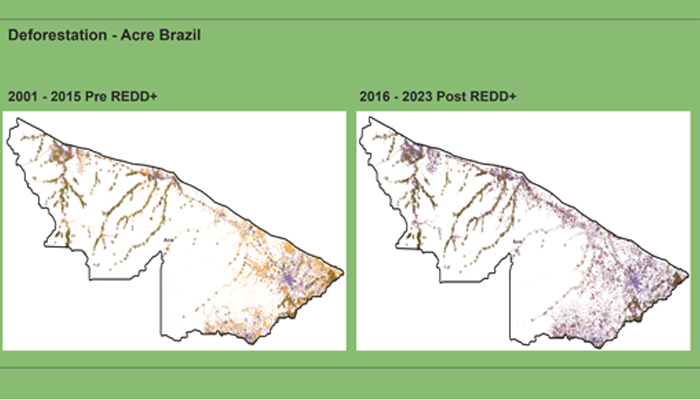
Orson Chansler | REDD+: What is it good for? Exploring deforestation rate before and after in Acre Brazil.
The state of Acre is home to three REDD+ projects. 90% of Acre is forested, but land use changes like agriculture, extractive economic activity, and population growth have led to an 11% decrease in forest cover (Global Forest Watch). This QQGIS project aims to answer one question: Does REDD+ stop deforestation? This project is grounded in the state of Acre, Brazil, and examines two periods of deforestation from 2001-2015, or “pre REDD+,” and 2016-2023, “post REDD+. This project used global forest data from Global Forest Watch and the Global Land Analysis & Discovery group, comparing deforestation levels from 2000-2023. Data from Human Data Exchange, like populated places and roads, was included for context. High-resolution imagery from ESRI was also included.
GIS PresentationProject Methods
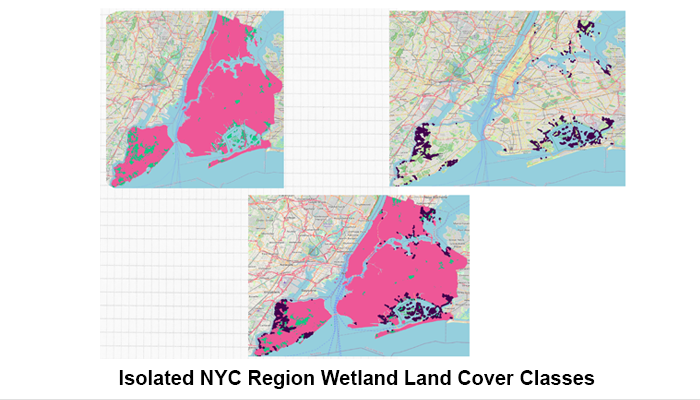
Kenton Archer | Mapping the unseen retreat: Analyzing Spatial Patterns of Wetland Loss in New York City’s Salt Marshes (2000- 2023)
This project investigates changes in wetland coverage in Southeast Queens, New York City, from 2000 to 2023. Utilizing data sourced from the NYC Open Data platform and the USGS National Land Cover Database (NLCD), the analysis highlights significant trends in land cover and wetland loss as well as gains over the specified period. The findings, which provide insight into the impact of urban development on wetland ecosystems in this region, are significant for conservation and land use planning in the project area.
GIS PresentationProject Methods
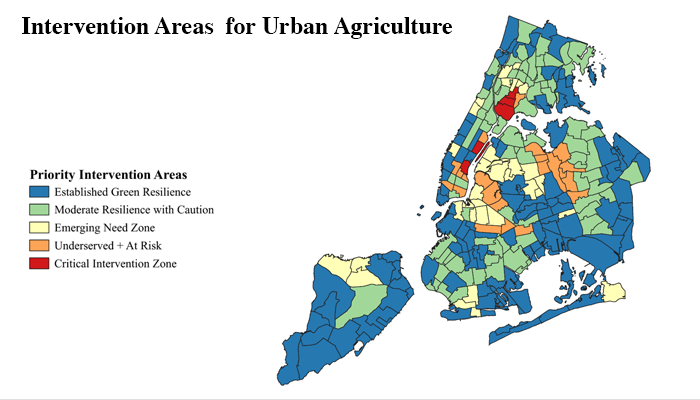
Emma Holtzman | Identifying Priority Areas for Urban Agriculture Interventions by Examining the Spatial Relationship Between Community Gardens + Exposure to Environmental Contaminants in New York City
This project spatially analyzes the convergence of environmental injustice, land contamination, and food insecurity in New York City to identify priority areas for community-based soil remediation and urban agriculture. The study focuses on marginalized neighborhoods with historical legacies of dumping, industrial pollution, and systemic disinvestment, particularly those with high environmental burdens and low access to healthy food or green space.
GIS PresentationProject Methods
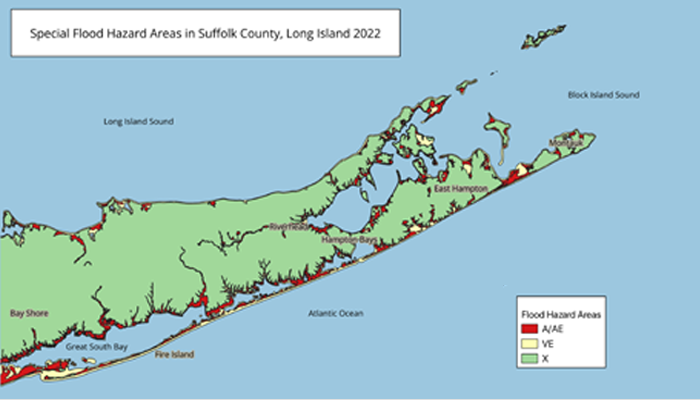
Chanda Cragnotti | Spatial Investigation of Southeastern Long Island
This project starts to explore the intersection between the coastal habitats of humans (represented by building footprints), and non-humans (through vegetation type and designated critical environmental areas), in a time of rising flood risk and erosion. The area of interest–the south-east shore of Long Island–was segmented into roughly small, mid and large scales; Suffolk county, the town of East Hampton and Villages of Napeuge and Montauk, respectively. I discuss the observations and comment on the heavy reliance of beach nourishment projects in these areas which have long term downsides for the microbial communities that live within sandy beaches as well as causing increased rates of erosion after the initial sediment gain.
GIS PresentationProject Methods